

Use containers, swimlanes, layers, shape data, and cross-functional flowcharts in Microsoft Visio.
This guide builds on the Visio Basics post. These features help when your diagrams grow more complex or when you need to share structured data alongside the visual layout.
A note on versions: Microsoft updates these apps constantly, and the exact wording, button placement and menu options can differ between versions, update channels and license types (perpetual vs Microsoft 365). If something on your screen does not match exactly what you see here, the feature is almost always still there, just in a slightly different spot or under a slightly different name. Use these guides as a map, not a pixel-perfect match.
Cross-Functional Flowcharts (Swimlanes)
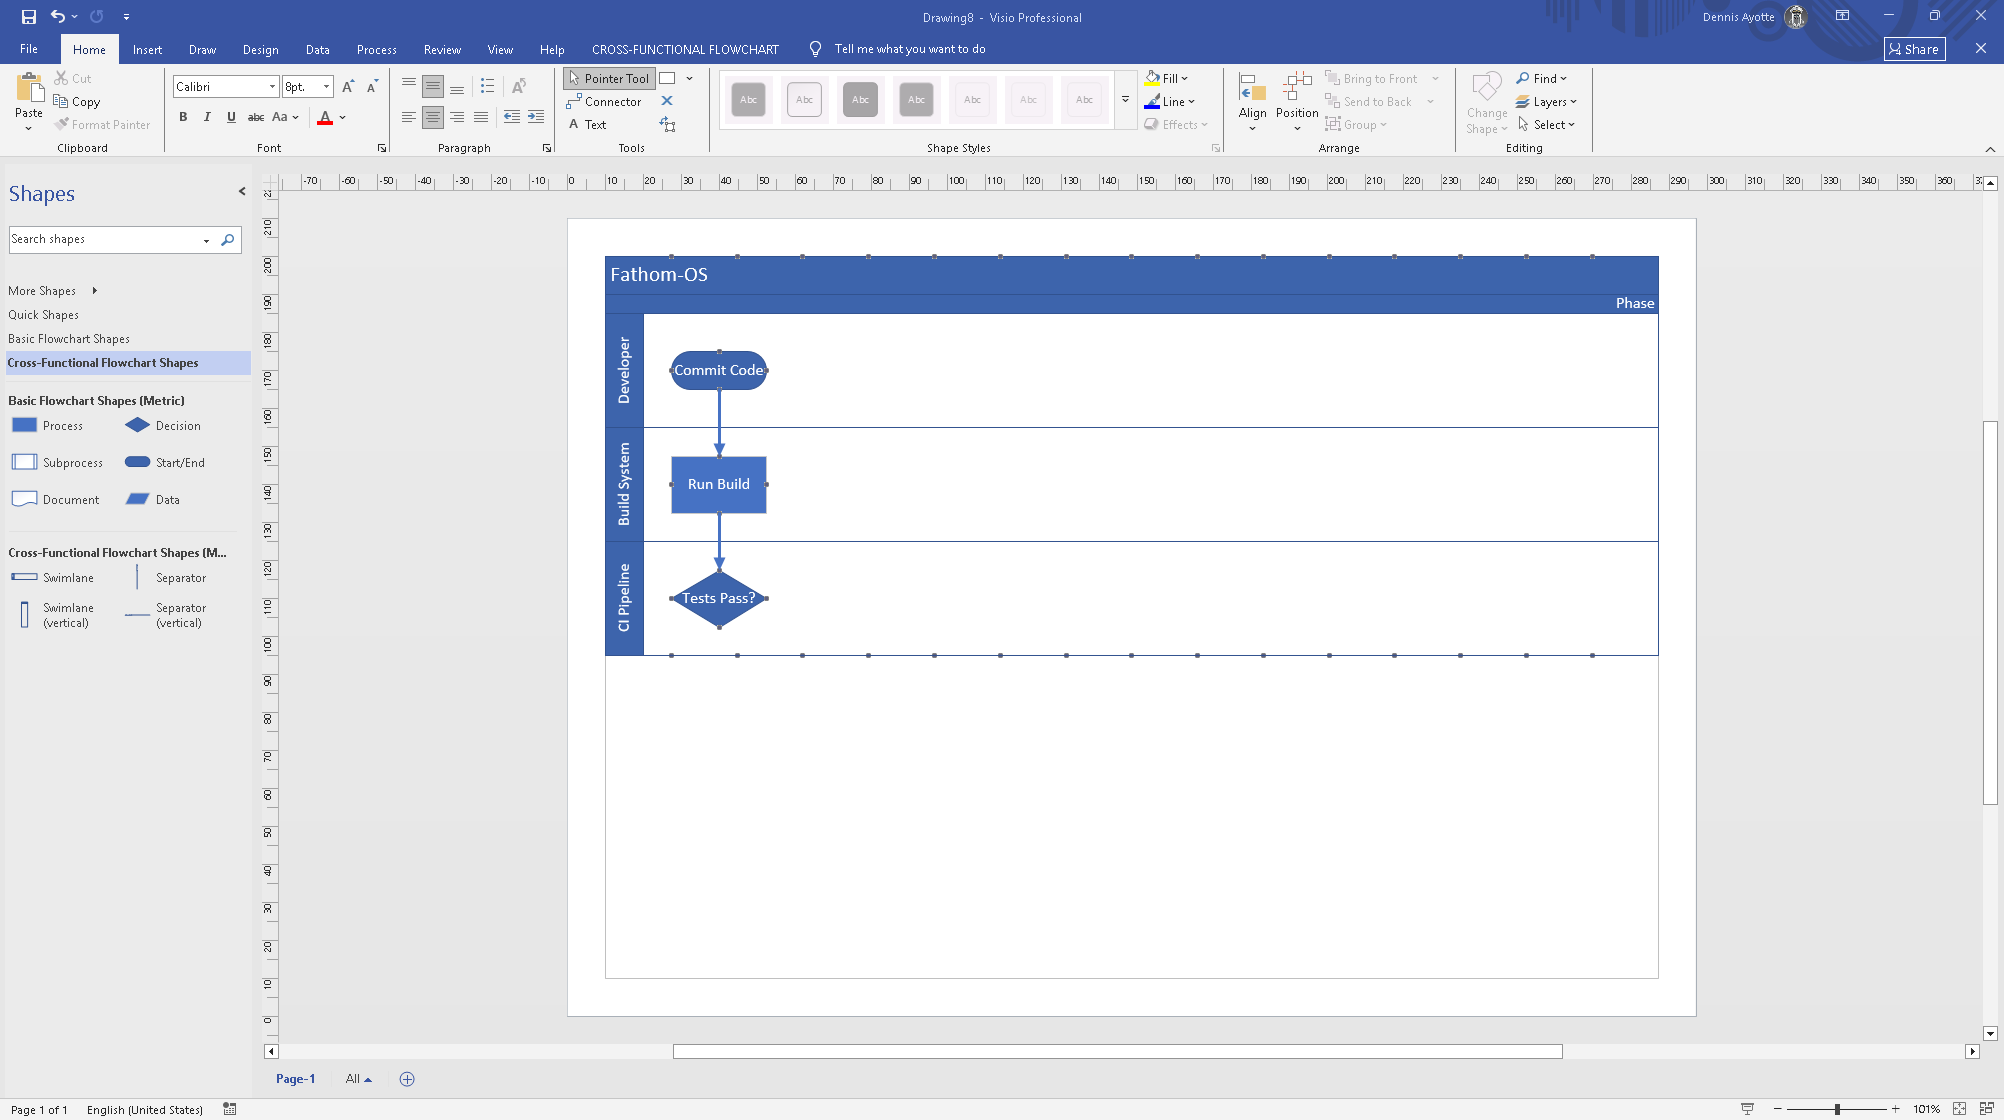
A cross-functional flowchart shows a process across multiple departments or roles, with each row (swimlane) representing one participant.
Go to File, New, choose the Flowchart category, and select Cross-Functional Flowchart. A dialog asks for the orientation (horizontal or vertical) and the number of swimlanes. Click OK.
Each swimlane has a label on the left (or top). Double-click the label to rename it. Drag shapes from the Shapes panel into the appropriate swimlane. Shapes snap to the swimlane they belong to.
To add a swimlane, right-click an existing swimlane label and choose Insert Lane Above or Insert Lane Below.
Containers
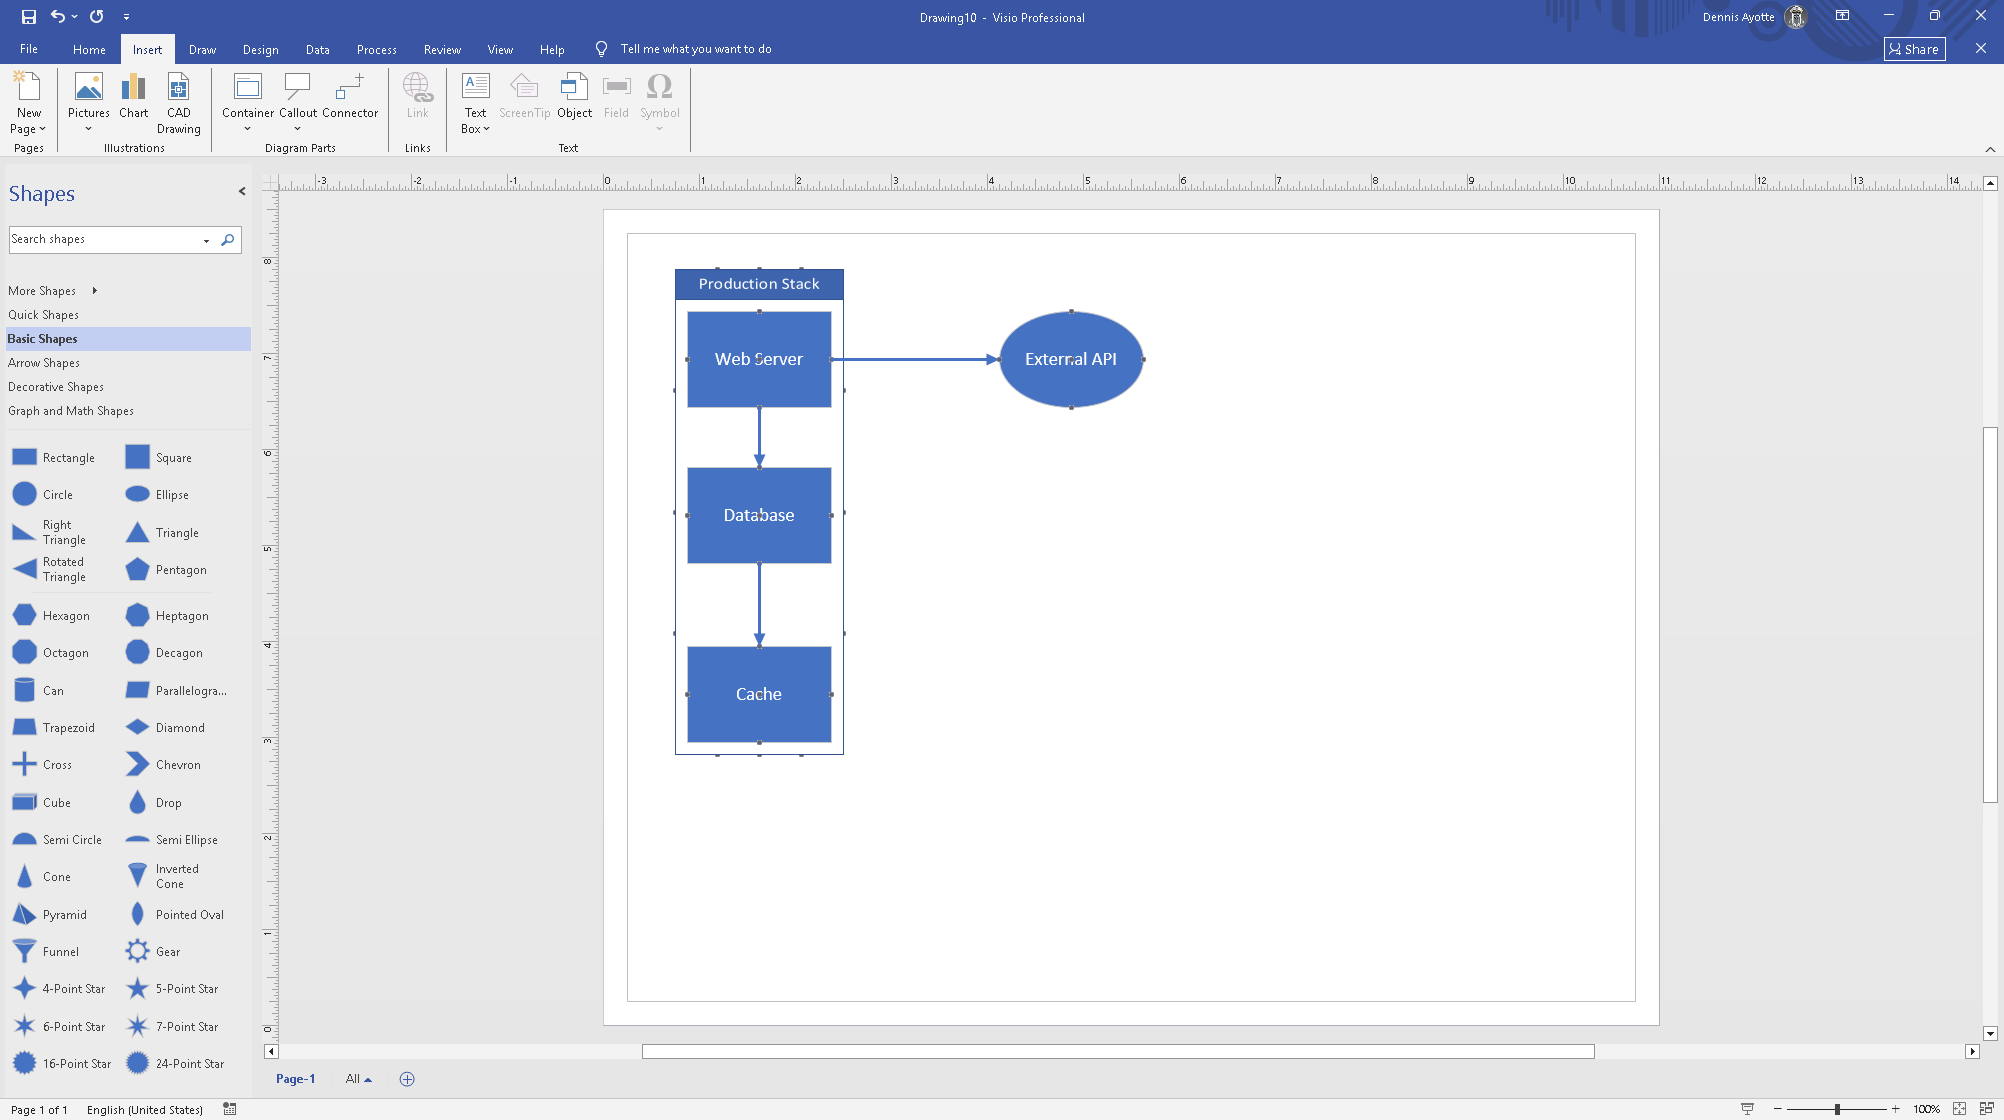
Containers group shapes visually and logically. Moving a container moves all shapes inside it together.
Go to Insert, Container and choose a style. Drag existing shapes inside the container border to add them to it. The container highlights to confirm the shapes are inside.
To add a label to the container, double-click the container header area and type.
Containers are useful for showing systems, servers, or departments that hold multiple components.
Layers
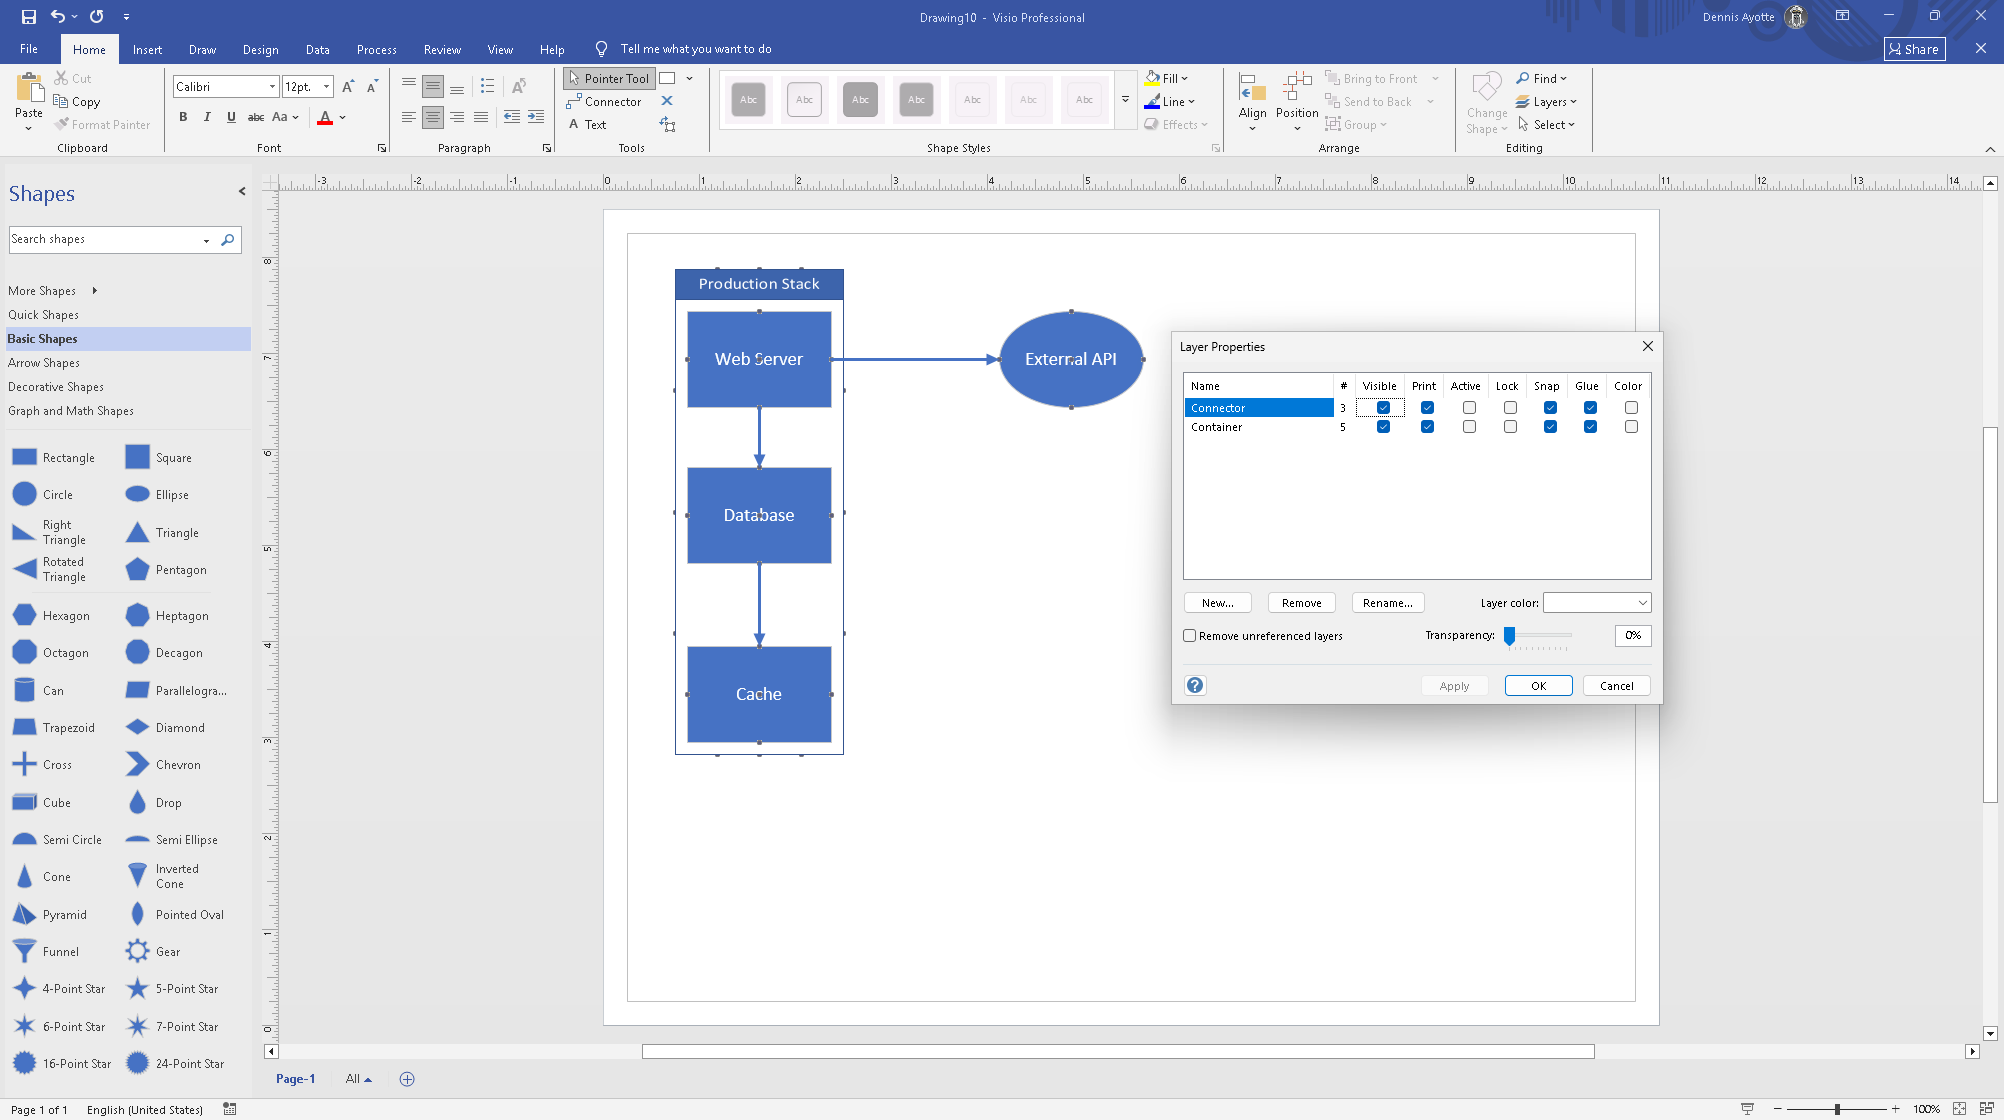
Layers let you group shapes so you can show or hide entire categories at once. As you build a diagram, Visio automatically creates layers for certain shape types, like one for containers and one for connectors. You can also create your own named layers to organize shapes however you want.
Go to the Home tab, click Layers in the Editing group, and choose Layer Properties to open the Layers dialog. Click New to add a layer and give it a name.
Each layer has a row of properties. Uncheck the Visible column to hide all shapes on that layer. Uncheck Print to exclude a layer from printed output. The # column shows how many shapes are currently on each layer.
To assign a shape to a layer, select it, then on the Home tab click Layers and choose Assign to Layer. Pick the layer from the list.
Shape Data
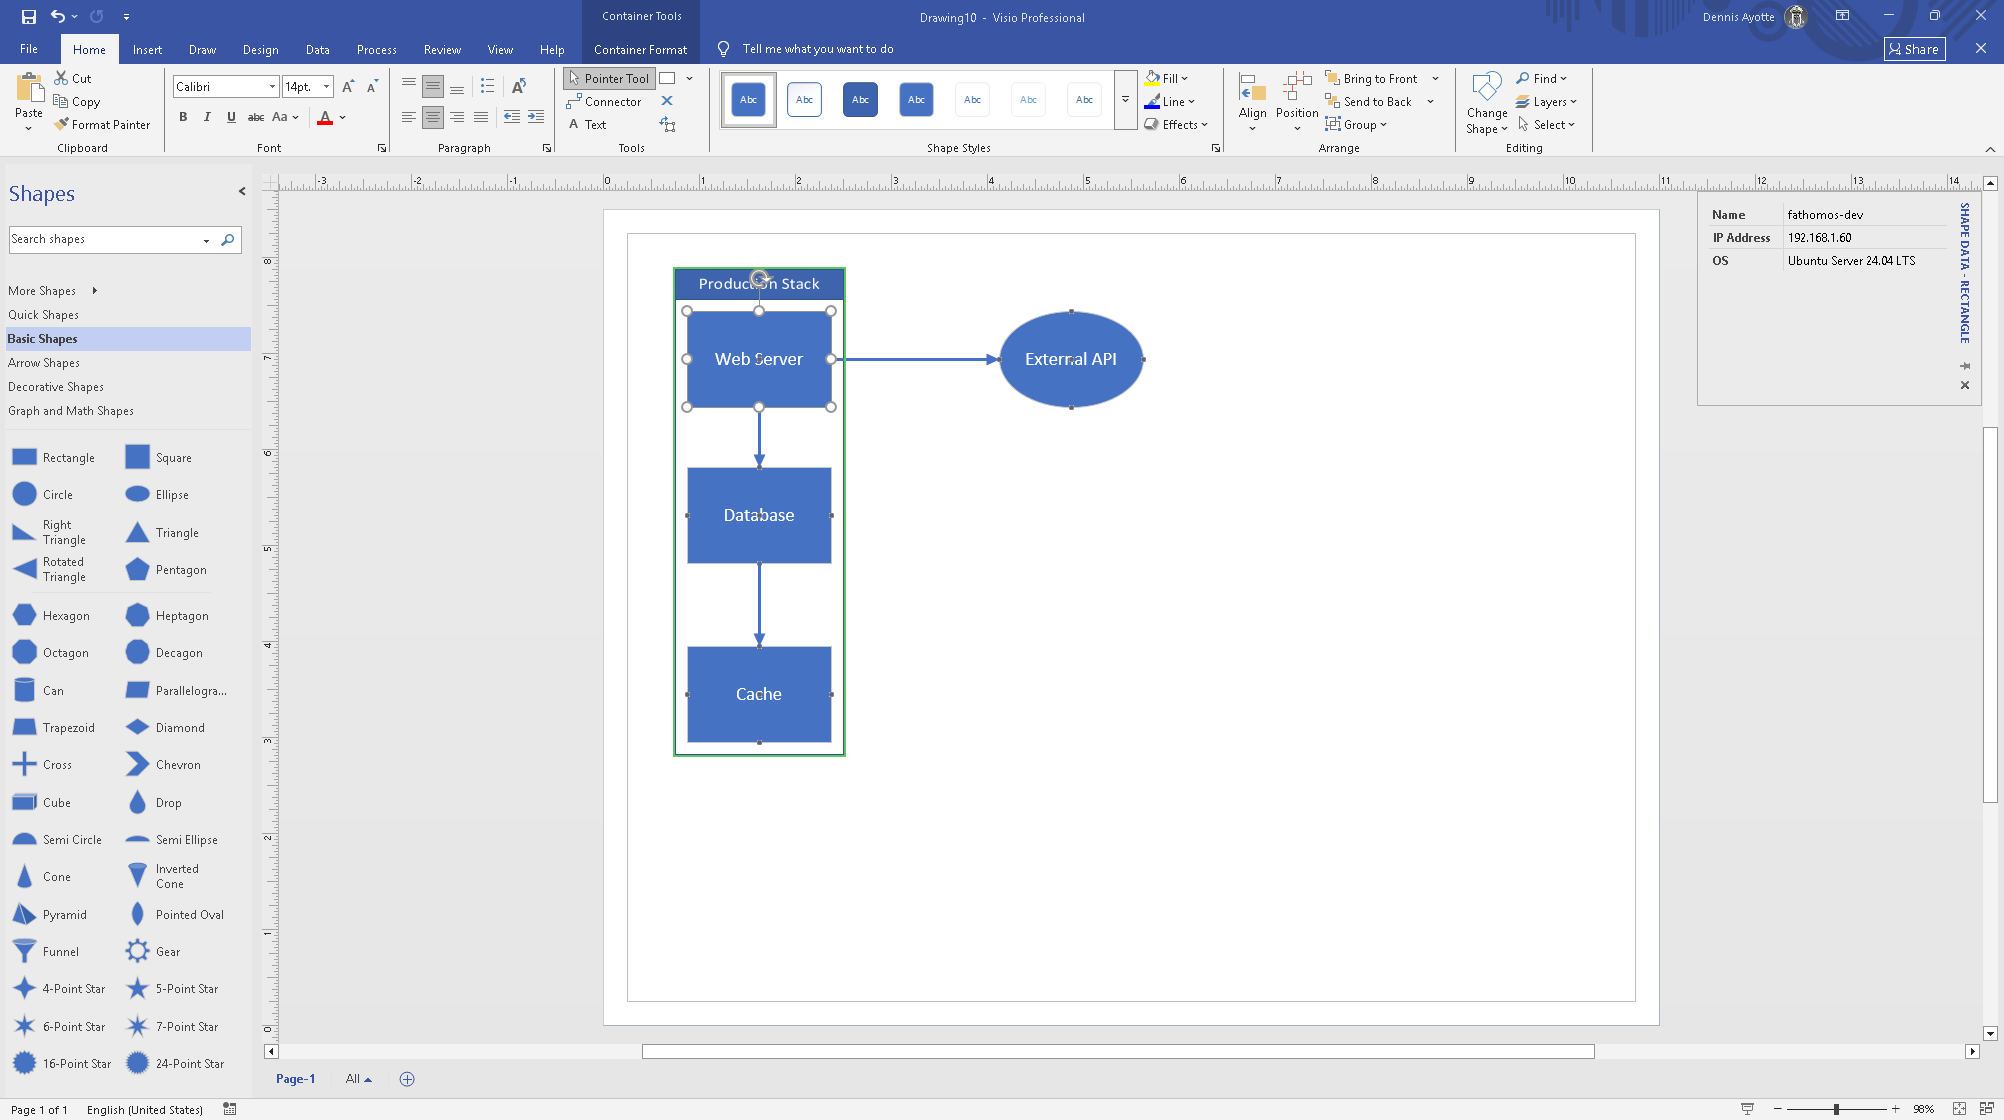
Shapes can carry structured data fields, not just visual appearance. This is useful for network diagrams where each server shape holds its hostname, IP address, and OS, or for org charts where each person shape holds their title and department.
Right-click any shape, choose Data, then Shape Data to view and edit its fields (or Define Shape Data to create new fields). The Shape Data window shows the field names and values for that shape. Click in a value cell and type to edit.
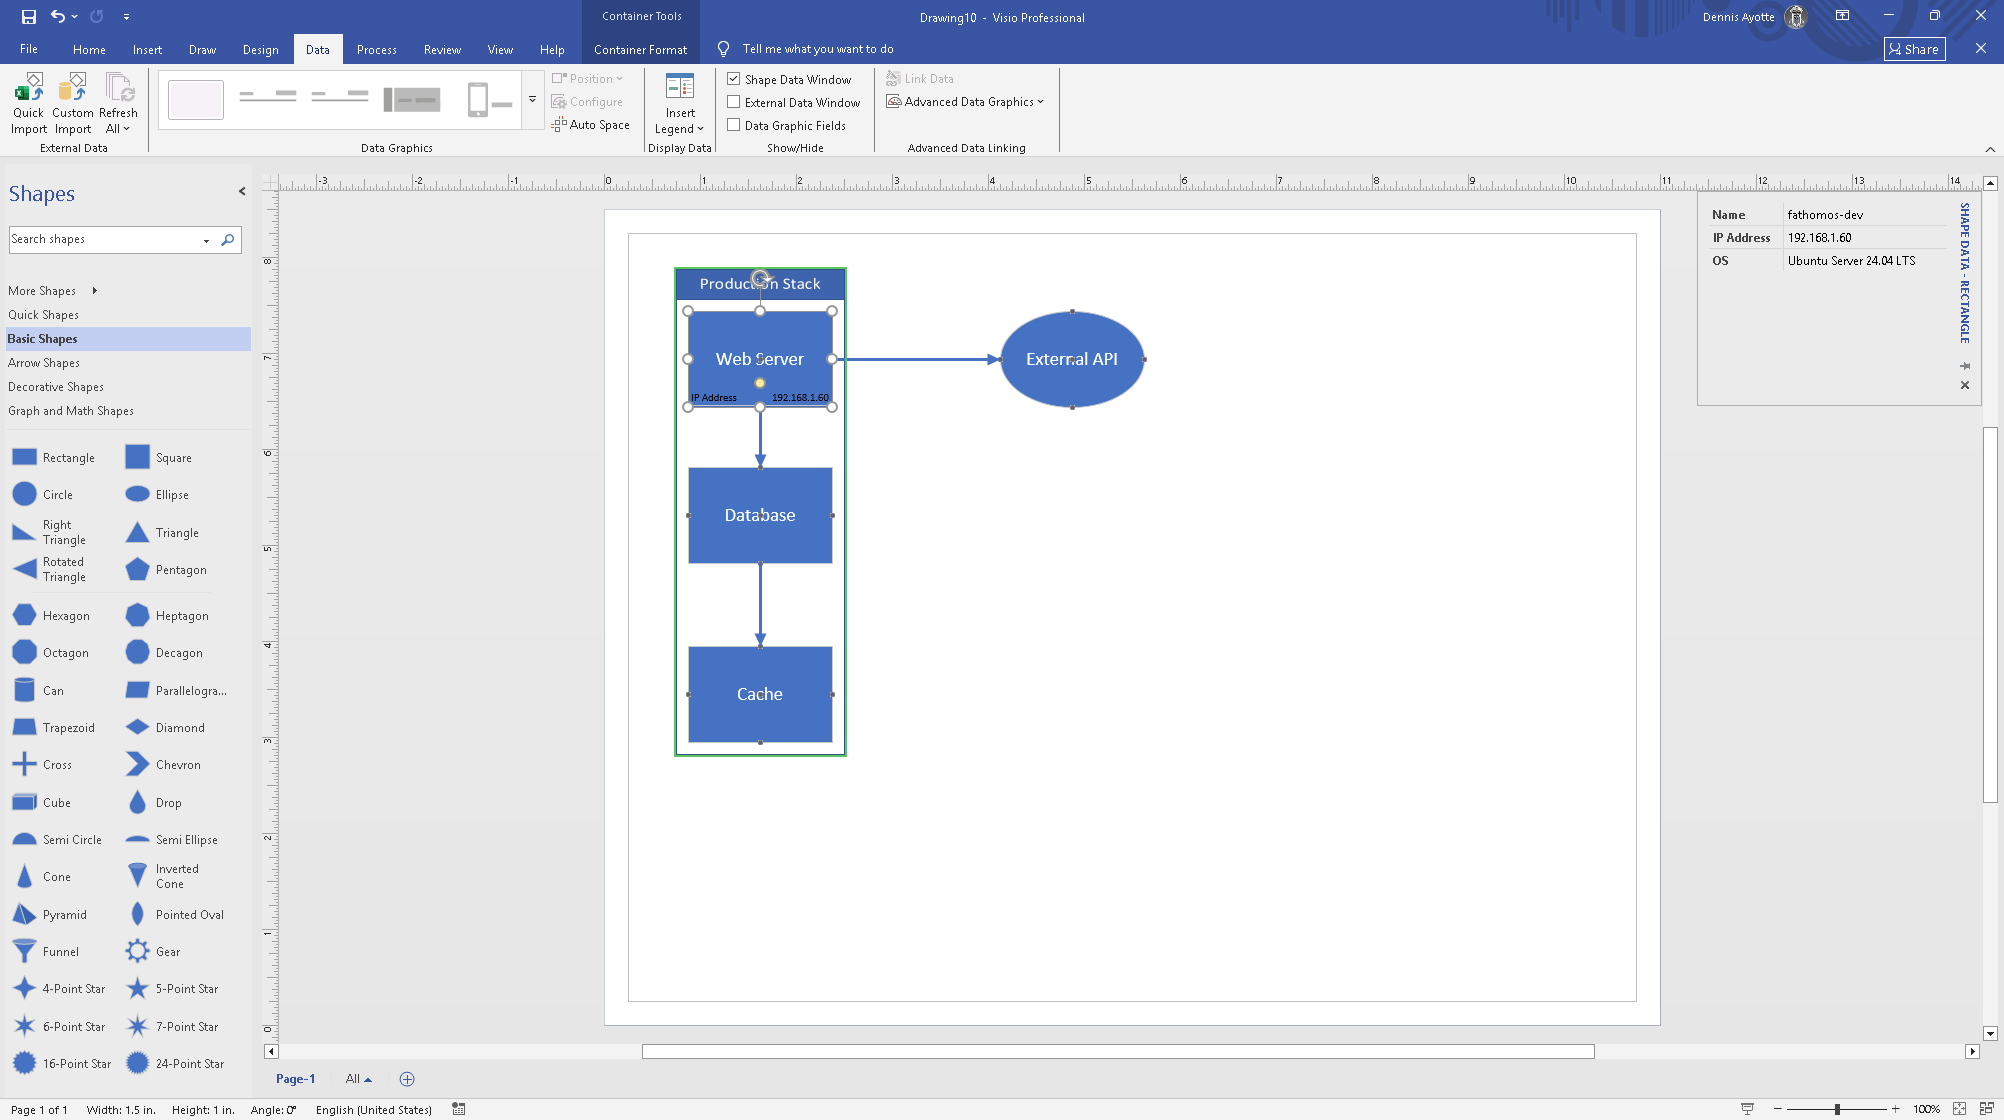
To view shape data in a panel, go to the Data tab and check Shape Data Window in the Show/Hide group. Click any shape to see its data in the panel.
Data Graphics
Data graphics display shape data visually on the diagram, such as a color indicator or a text callout showing a field value.
Select one or more shapes. Go to the Data tab and open the Advanced Data Graphics dropdown, then choose Create New Data Graphic. Click New Item, choose the data field to display, and choose how to display it (text callout, color by value, icon set, or data bar). Click OK to apply. Once created, the graphic appears in the gallery so you can apply it to other shapes too.
Callouts
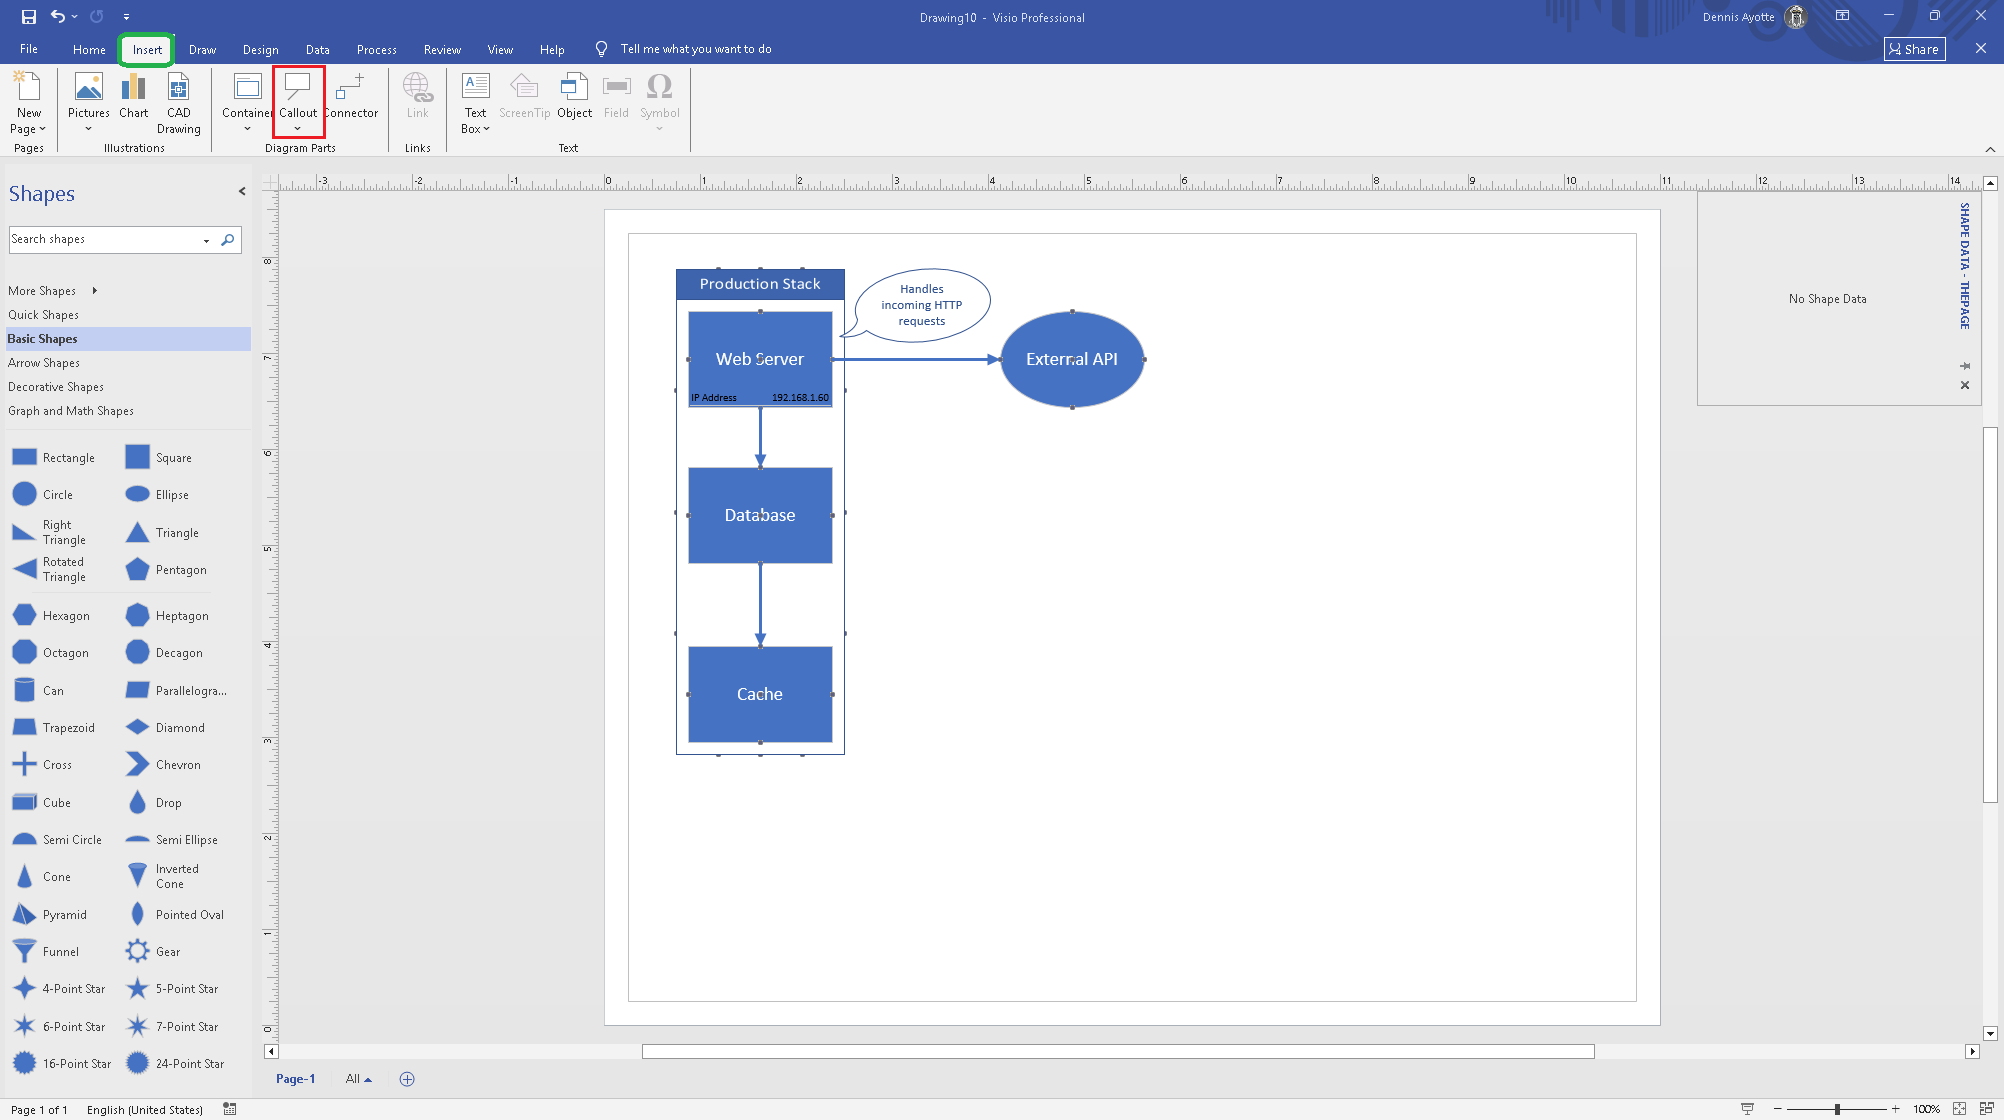
A callout is an annotation bubble attached to a shape, used to add notes without cluttering the main diagram.
Select the shape you want to annotate. Go to Insert, Callout, and choose a style. The callout attaches to the shape and moves with it. Double-click the callout to add text.
Pages
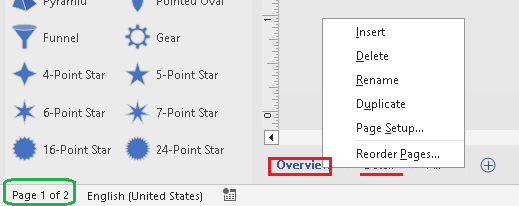
A Visio file can contain multiple pages (tabs at the bottom), useful for multi-level diagrams such as a high-level overview on page 1 and detail diagrams on subsequent pages.
Right-click any page tab at the bottom and choose Insert to add a new one. Double-click a page tab to rename it, or right-click and choose Rename. Drag page tabs to reorder them.
To link a shape to another page, right-click the shape and choose Hyperlink. Set the destination to a page in the same file. Clicking the shape in presentation mode jumps to that page.
Exporting for Different Uses
- PDF - File, Export, Create PDF/XPS. Best for sharing a static version.
- PNG or JPEG - File, Export, Change File Type, then choose an image format. Good for embedding in documents or presentations.
- SVG - File, Export, Change File Type, SVG. Scales without losing quality. Use for web or high-resolution printing.
- AutoCAD (DWG/DXF) - available in Visio Professional. Used for engineering and architecture handoffs.
Links
- Microsoft Visio help and learning
- Create a cross-functional flowchart
- Use layers to set properties for multiple shapes
- Add data to Visio shapes
Anything unclear or a step I missed? Let me know below.
New to this topic? Start with: Microsoft Visio Basics: Diagrams, Shapes, and Connectors
// comments